TITLE
OpenEarth
SUPERVISOR
Fabio Franchino

ABSTRACT
OpenEarth is a data-driven explorative platform designed for companies that want to show their commitment to environmental sustainability and increase their credibility with users. To achieve this, the platform utilises data from companies by visualising it in a digital and interactive context, enabling them to monitor and improve their sustainable development initiatives. This public data showcase can be exploited for research purposes by scientific researchers and greatly increase the transparency of the company itself. A second purpose is to fulfil the need for transparency demanded by users as necessary for a more environmentally sustainable future and to diminish the distrust caused by greenwashing. Such a point of contact will allow people to interact with the content with a playful but also informative aspect, allowing them to delve deeper, immersing themselves within the content to explore it. At the end of the journey, it is also possible to make comparisons between companies with similar metrics to gain an overall view of the situation.
INTERFACE AND INTERACTION MODALITY
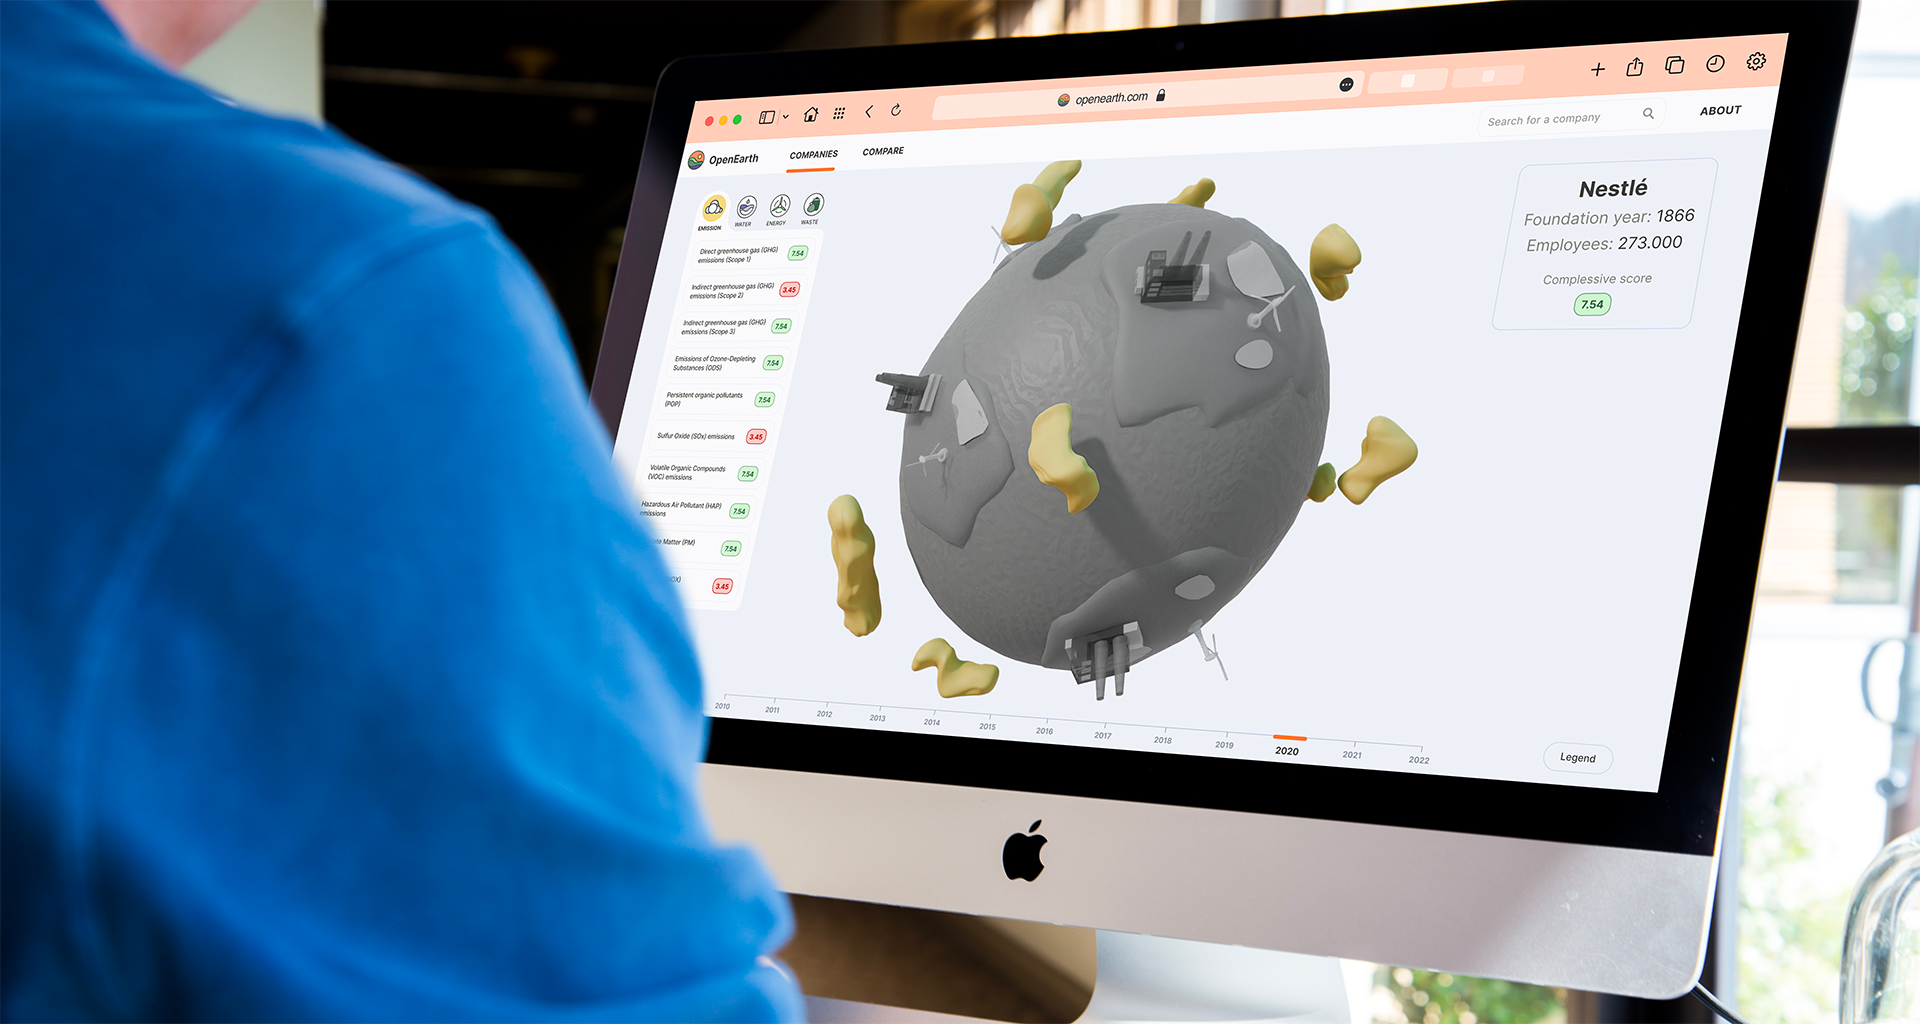
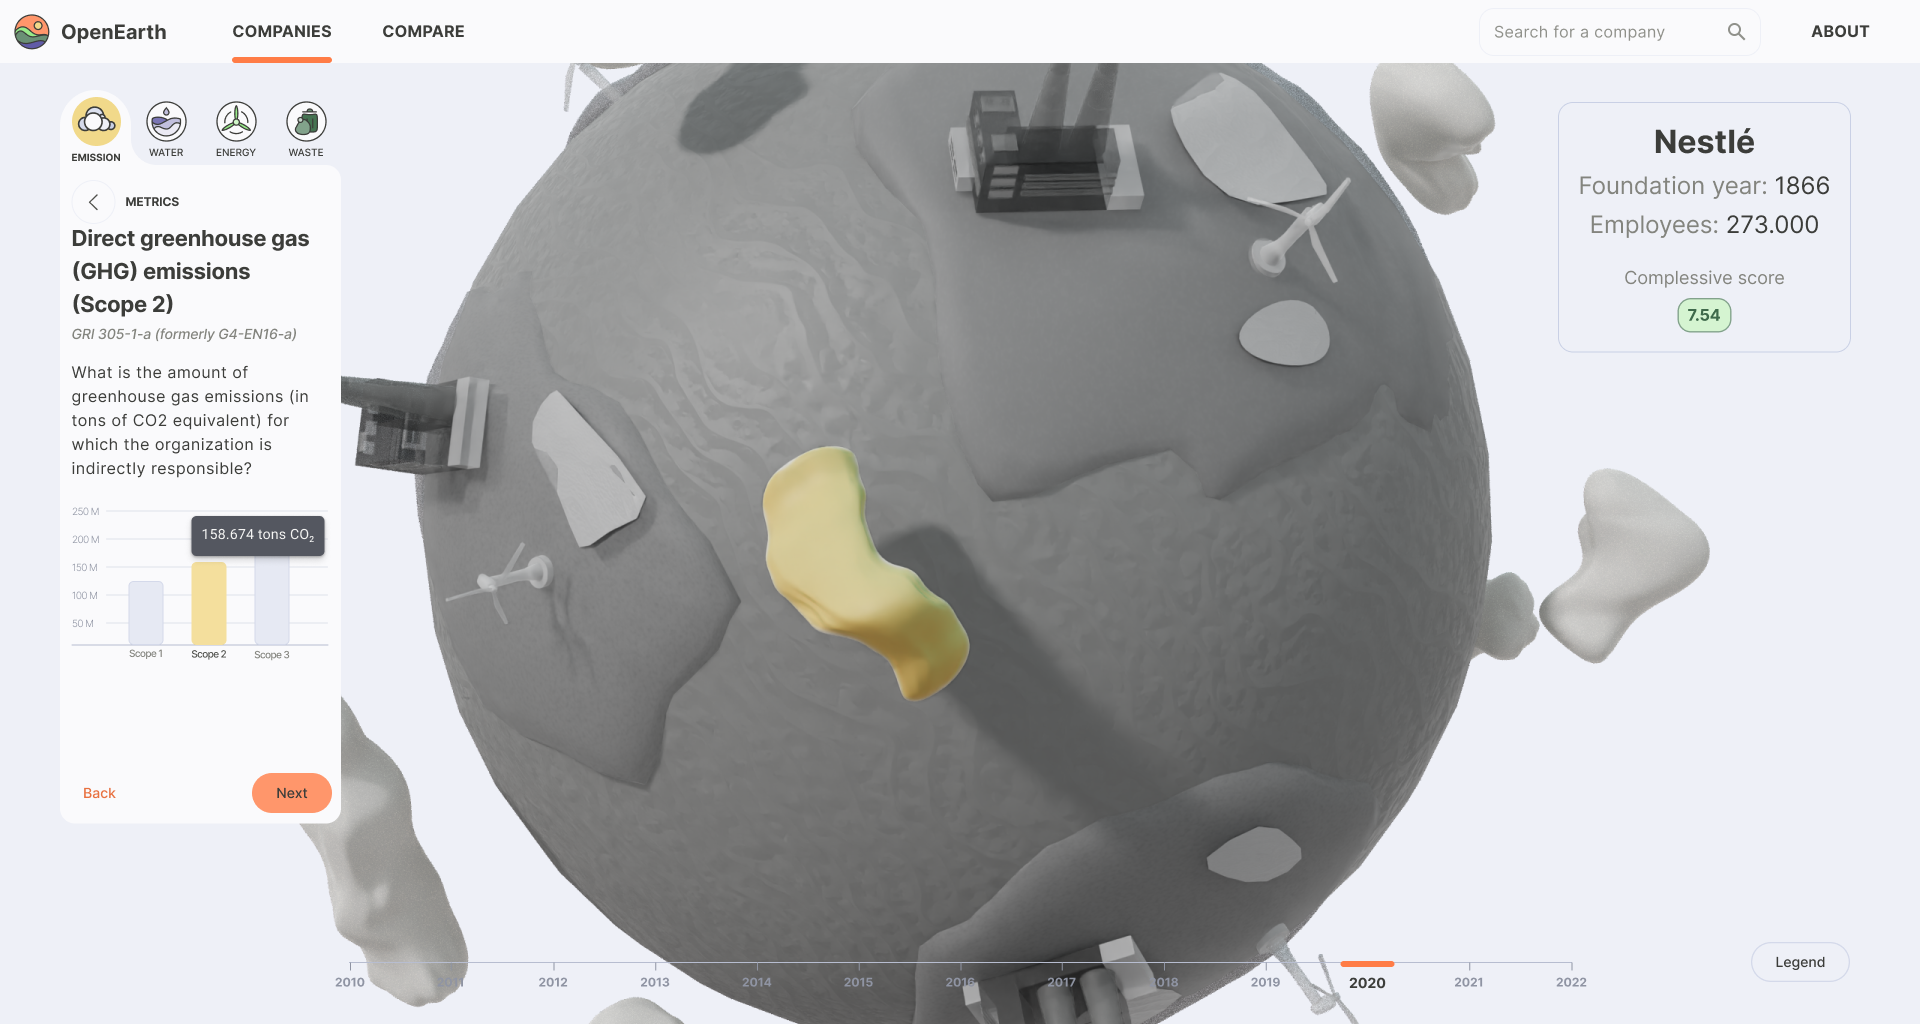
OpenEarth consists of a single point of contact where the metaphor of a planet is used to allow a wide range of items to be linked to a single piece of data. Starting from the single company view, the user can access the detailed information of a metric by clicking on the element within the planet view, or through the list of metrics.Through the slider that represents the timeline, it is also possible to choose the year of the displayed metrics.All data comes from Wikirate, using a python script which, through the provided APIs, has made it possible to obtain a total of about 30 values for each company for each year. After the database was created, all data was processed by a second algorithm, which normalized all values in a range from 0 to 10 based on the total number of employees. The 3D visualization used in the Figma prototype was created on blender, while for the final prototype, the 3D model was generated using javascript with the three.js library. This has made it possible not only to generate a different model for each company and different for each reference year, but also to make it interactive and to link each element to a specific page.


USER EXPERIENCE
At the beginning of the experience, the user will be guided by a narrative that will serve as an onboarding towards possible ways of interaction. Subsequently, it will be possible to explore the data more freely by interacting with the visualisation of a universe populated by as many planets as there are companies in the database. After choosing a company to explore, the user will find a 3D visualisation of the planet generated from the data of the same company whose environmental impact is being explored. Each element corresponding to a metric will be interactive and allow access to an information section with more details.
RESEARCH AND DEVELOPMENT CONTEXT
Among possible developments is certainly the possibility of improving data acquisition by designing a special company-side section for data entry, including the possibility of uploading the report in pdf format and having it processed by a data scraper algorithm. Since it is expected that in the coming years the sharing of a sustainability report will also be mandatory for small and medium-sized companies, it would certainly also be important to develop a guidance system to accompany companies towards the acquisition of such data.
Link to the funcional prototype:
https://openearth-supsi.netlify.app/